13 KPIs to measure the success of your mobile travel app

Alex Ragin
Updated May 14, 2024 • 14 min read
You’ve built a travel app and launched it to the world. Now it's time to see how it's doing by tracking some metrics. As an app owner, you need to know what's working and what’s not so you can make tweaks to improve the user experience. Measuring key performance indicators (KPIs) will tell you if your app is on the road to success or needs a major detour.
In this article, we'll explore 13 of the most important metrics for travel and tourism app development. Whether it's active users, retention rates or conversions, having your finger on the pulse of these metrics will help ensure your app is high-performing and delivering value.
User engagement metrics
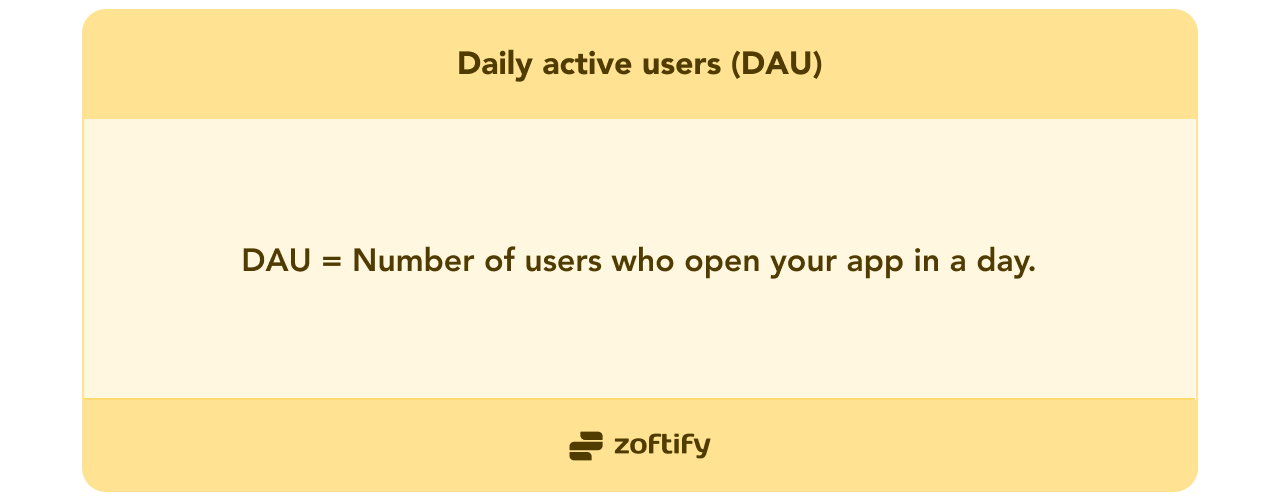
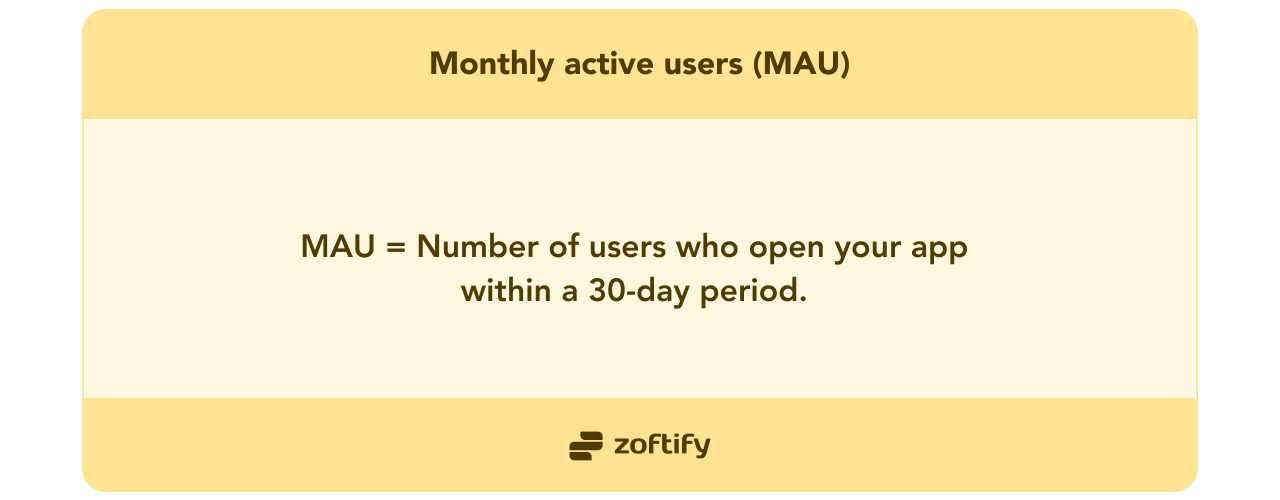
Daily active users (DAU) / monthly active users (MAU)
Daily active users (DAU) refers to the number of unique users who engage with your app on a given day.
Monthly active users (MAU) tells you how many unique users opened and interacted with your app within a 30-day period.
This is one of the most important metrics for travel mobile apps. Why? Because engaged, loyal users are the lifeblood of any app. They're the ones who will keep coming back time and time again, explore all your app has to offer, and are most likely to book something or make purchases.
Want to grow your active user base? There’s a few things you can do:
- Create a seamless and satisfying onboarding process to turn newcomers into regular users.
- Send personalized push notifications to regain users’ attention.
- Collect feedback to reestablish contact with inactive users and learn about their travel habits.
But remember, people don't book flights or hotels every day, even if they travel frequently. Analyze this metric based on your travel app’s purpose and your users’ expected behaviors.
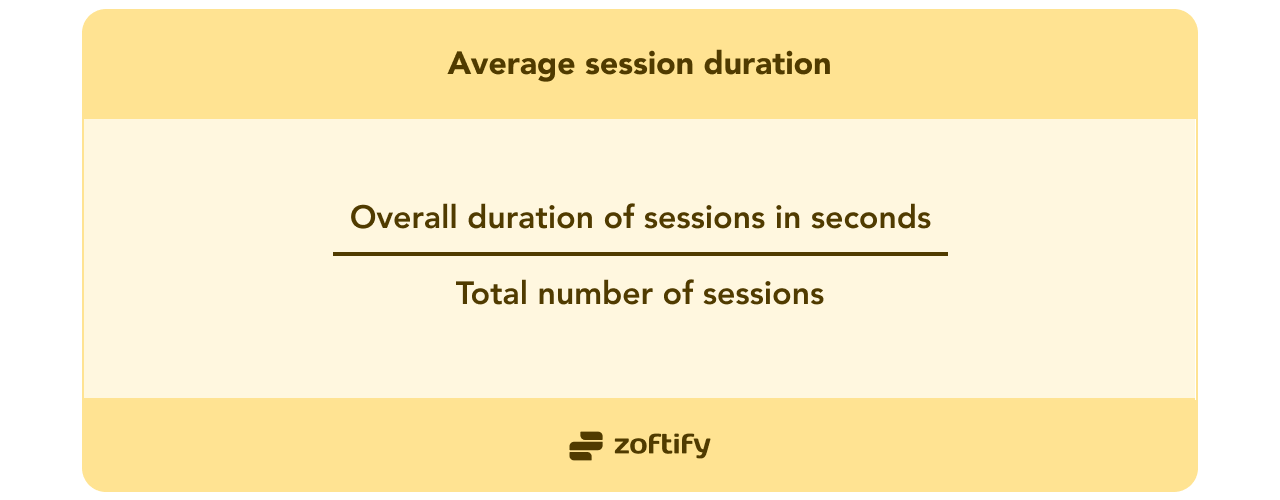
Average session duration
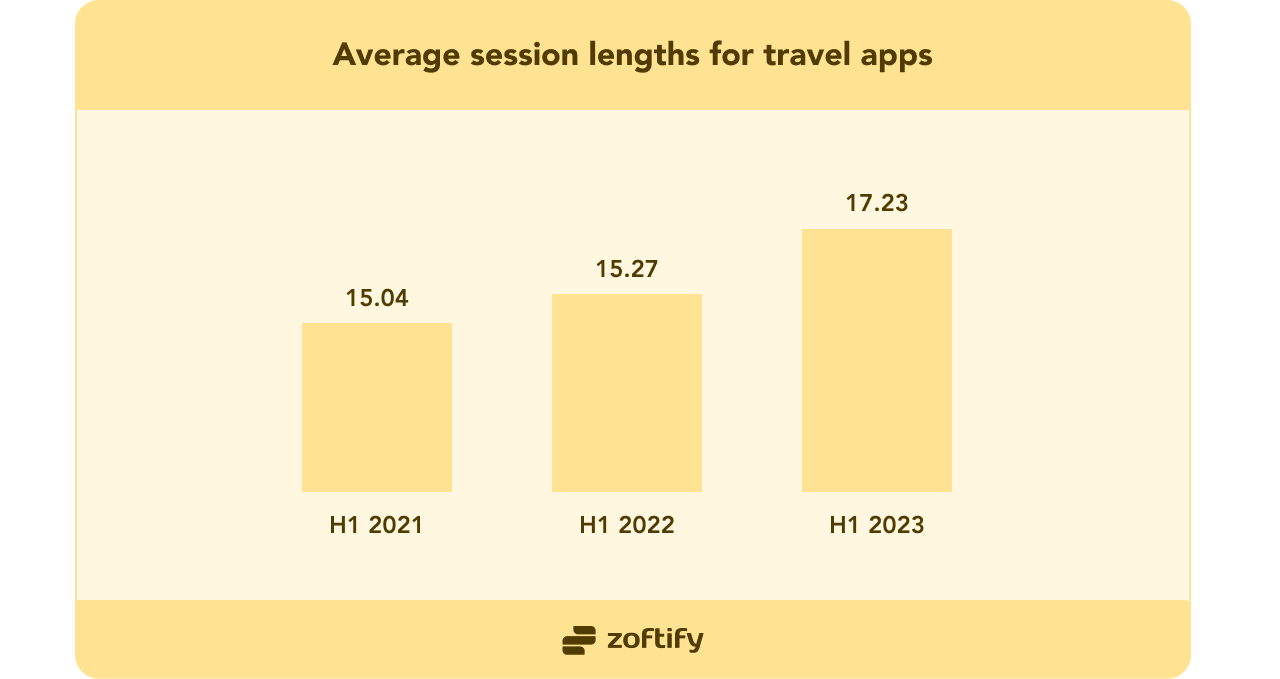
When it comes to measuring how engaged your users are, average session duration is a key travel app metric to track. This tells you how long, on average, people spend using your app per visit.
If users spend a lot of time in your app, then it means they find value in what your app offers. For mobile travel apps, the ideal average session duration ranges from 15 to 17 minutes, according to Adjust data. Let’s look how the averages have changed slightly in recent years:
Start by aiming for an average session duration of 8 to 10 minutes, then try to make it longer. Here’s how:
-
Focus on enhancing features that facilitate in-depth planning and research.
-
Incorporate travel stories, blogs, and itineraries within your app that encourage users to read and learn.
-
Add simple games or challenges related to travel to entertain users and keep them exploring.
Track travel application KPIs and drive success.
Get in touch with Zoftify for expert advice.
Conversion metrics
Conversion rate
To effectively measure how well your mobile travel app is performing, focus on your conversion rate. This refers to the percentage of people who take a desired action after visiting your app, like making a purchase or booking a trip. Our travel mobile app development company follows data-driven design and development principles. Therefore, we not only create apps, but also make sure they work effectively.
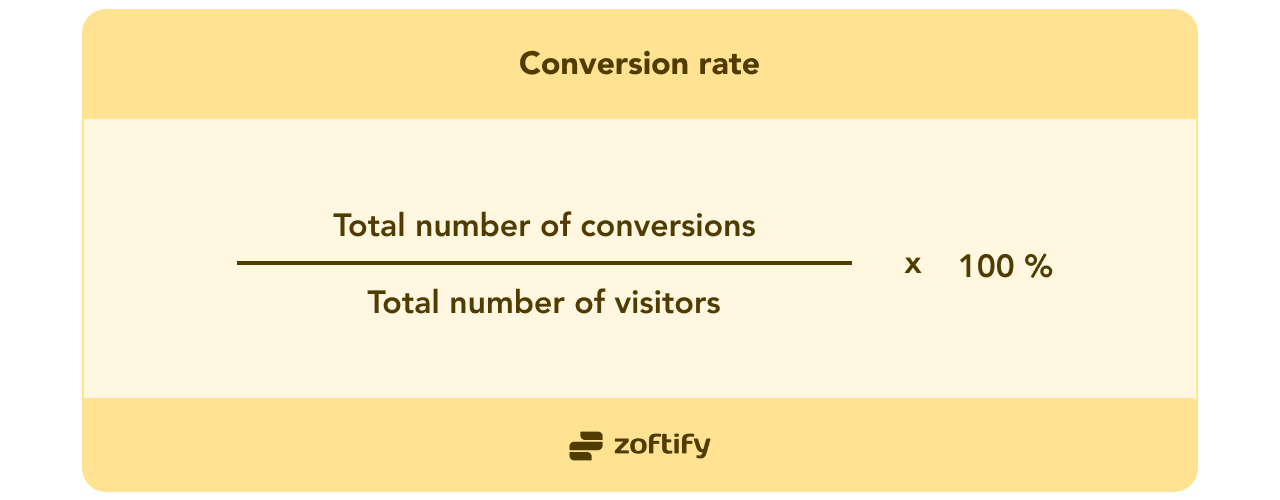
The higher your conversion rate, the better. Aim for 1-3% to start (the industry average is 2%).
A high conversion rate means your app successfully convinces users to do what you want; if it's low, there may be blockers stopping people from taking action. Work through these questions to improve your conversion rate:
- Is the booking process complicated or confusing? Simplify the steps required and provide clear instructions.
- Are there technical difficulties preventing bookings? Test your app thoroughly to identify and fix any bugs.
- Do you need to improve trust and credibility? Highlight security features, testimonials, and your refund policy.
- Is your content engaging and inspiring? Use enticing photos, videos, and descriptions to spark interest in destinations and deals.
- Are your prices competitive? Compare rates with other travel sites and apps to ensure you’re offering good value.
- Is your call to action persuasive enough? Place “Book Now” or “Complete Purchase” buttons prominently.
Receive travel tech insights directly in your inbox

Time to first purchase
Time to first purchase is one of the most crucial travel mobile app KPIs. It shows how long it takes for new users to make their first in-app purchase or booking after downloading your app.
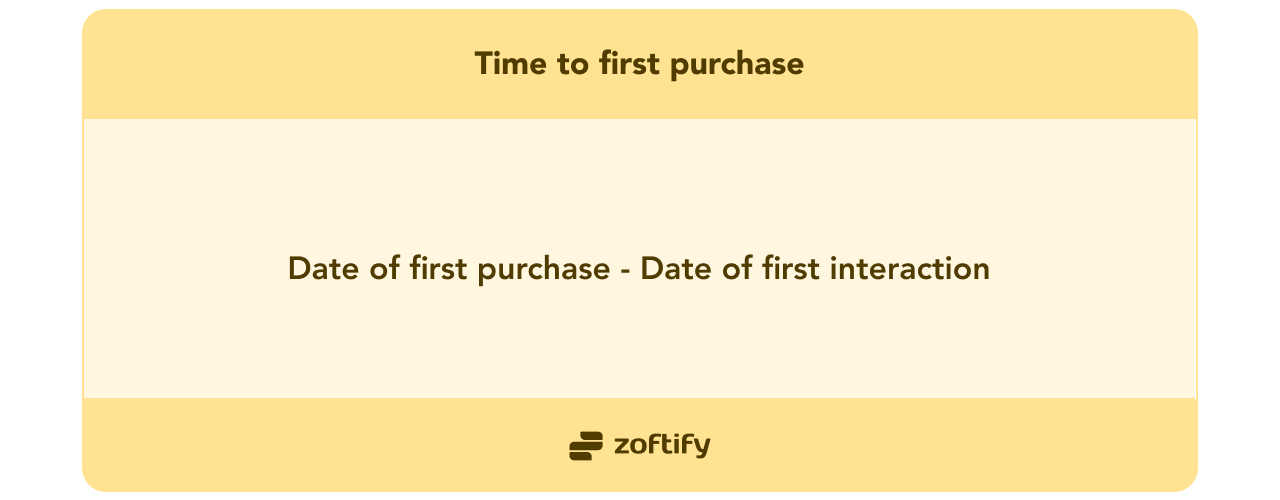
If users purchase or book something relatively quickly, like within a few days, hours, or even minutes, then it's a good sign. This means your app is providing value and keeping users engaged. If this figure is high, like a few weeks or months, you may need to re-evaluate your user experience and purchasing flow. Do note that, on average, only 42% of recently registered users complete a transaction in the first month.
To improve the time to first purchase, you can:
-
Offer discounts and promotions for first-time buyers on iOS or Android. Giving people an incentive to buy early can be very effective.
-
Suggest relevant products as soon as users launch your app. You might show deals on hotels, flights, or activities in different destinations.
The key is understanding your customers and what motivates them to buy. By optimizing your app to get people purchasing quickly, you'll see higher lifetime value and faster growth.
Booking abandonment rate
Abandonment is when a user starts the booking process in your travel app but leaves before completing the purchase. This KPI for mobile travel apps helps to highlight when there are issues in your booking flow that are frustrating users and causing them to quit.
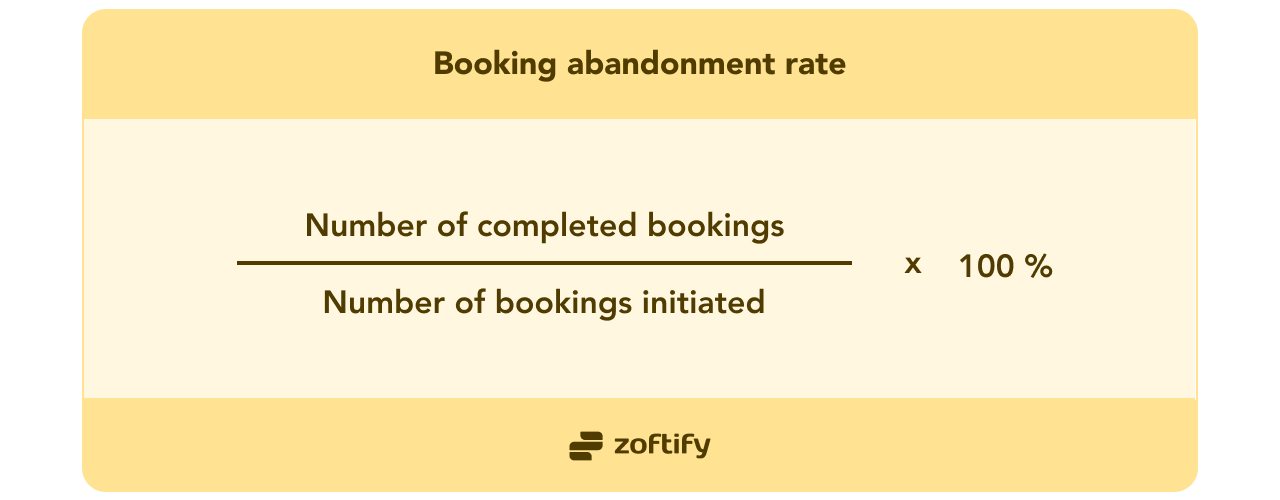
Booking abandonment rates are often high when the payment process is confusing or there are surprise fees, but sometimes people just get distracted or interrupted. Here are the averages for apps in different travel and travel-related niches, for comparison:
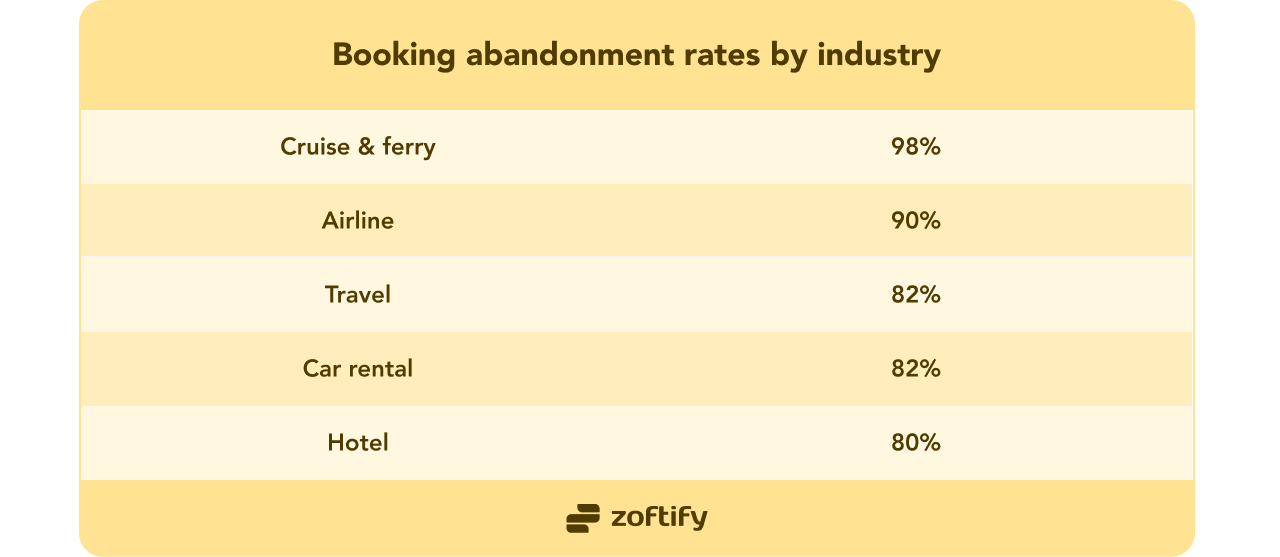
If your booking abandonment rate is higher than industry average, then something isn’t right within your app and it’s costing you sales and revenue. Ask yourself:
- Are prices or fees surprising users at the last second? Be upfront about all charges as early as possible. No one likes hidden fees.
- Is your app timing out or crashing during booking? Nothing is more frustrating than an app crashing in the middle of a transaction. Fix any technical issues immediately.
- Do you have a progress indicator to show how much of the booking process is complete? This helps set expectations and encourages users to finish.
User retention metrics
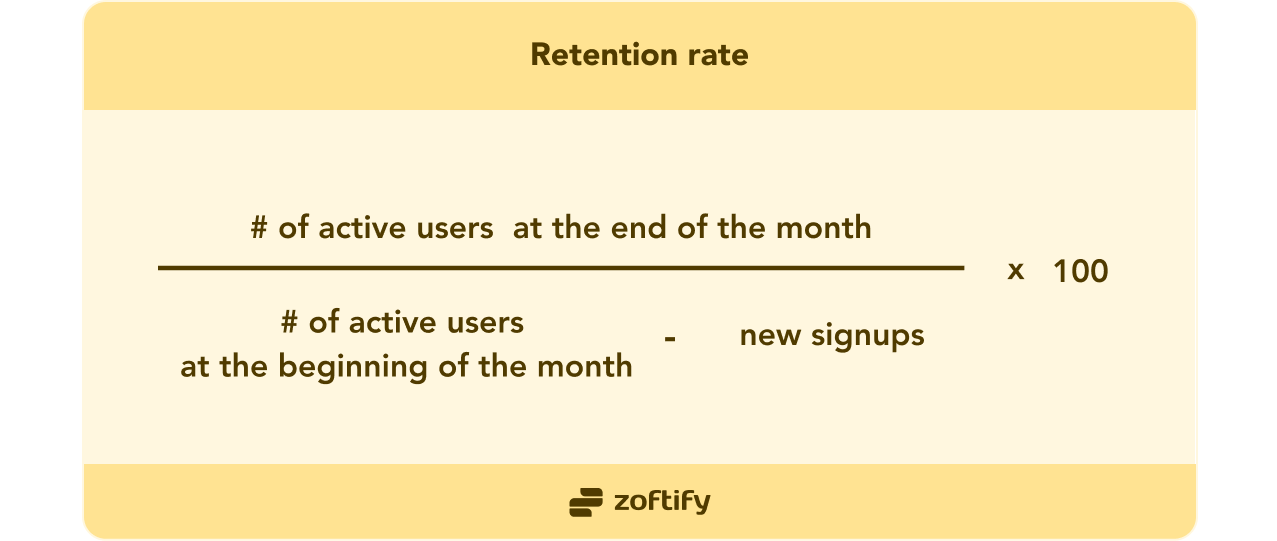
Overall retention rate
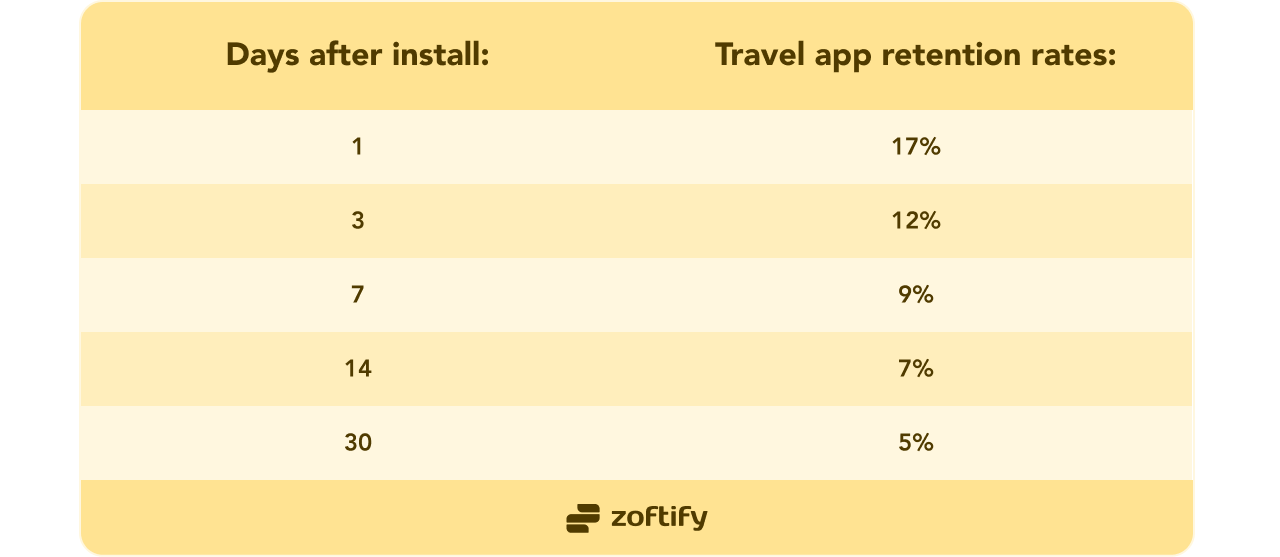
Retention rate is one of the most important travel mobile app engagement metrics. This KPI shows the percentage of users who continue to use your app over a given period, like a week, month, or quarter.
A high retention rate means users find your app useful and engaging enough to keep coming back. But be realistic with this metric — according to Adjust data, retention rates for the travel industry are not that high overall. They look like this:
As an app owner, retaining users should be a top priority. With the right approach, you can improve travel app engagement rates quickly and easily. Here are some tips to help you:
-
Improve UI/UX. Use a simple design, add good quality imagery, and keep it neat. Users will come back if they enjoy using it.
-
Implement A/B testing. Test different app versions to find what users like. Stick with the option that gets the best feedback and keeps users interested.
-
Make it personal. Gather data from search histories and recently-visited destinations to show users content that they'll like.
To learn more, read our article on improving this travel mobile app performance KPI.
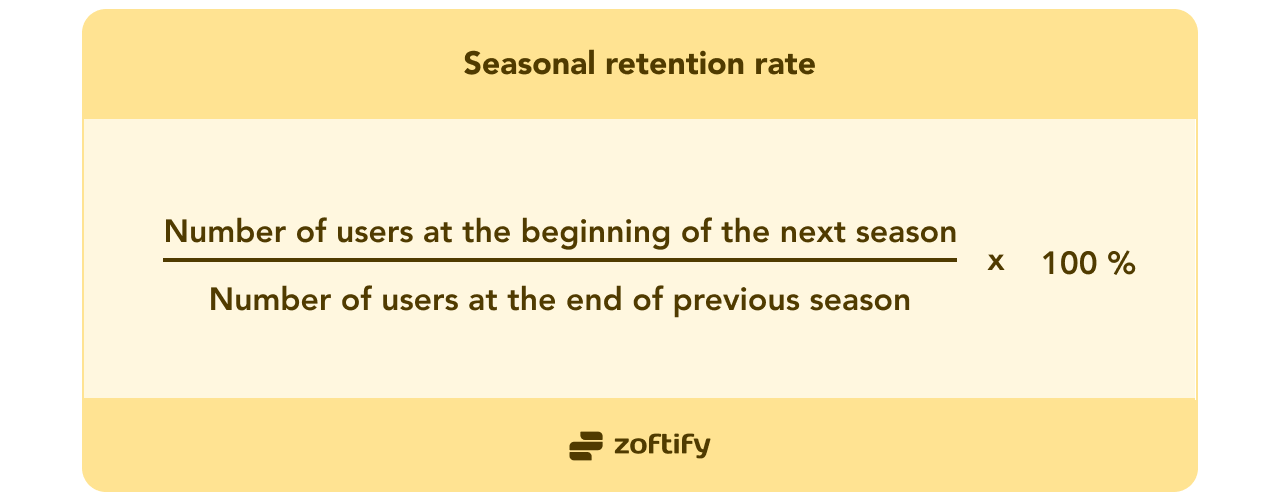
Seasonal retention rate
This KPI for travel applications measures how well your app retains users from one season to the next. For travel apps, seasonality plays a big role in usage and retention. People travel more during summer and holidays, so you'll likely see higher retention rates during those times. In the off-season, retention may dip.
Your goal should be to keep as many users as possible engaged year-round. Some tips to boost off-season retention include:
-
Highlight year-round destinations. Promote places people can visit any time of year. This may spark their wanderlust even when the weather's cold.
-
Introduce new in-app features like a bucket list or wishlist. Encourage users to save future trips they're interested in.
-
Send push notifications with travel inspiration and tips. Keep your app top of mind by sharing photos of dream destinations, packing reminders, or travel hacks.
-
Offer discounts or promotions during off-peak times. Give users an incentive to keep using your app even when it’s not a popular time to travel.
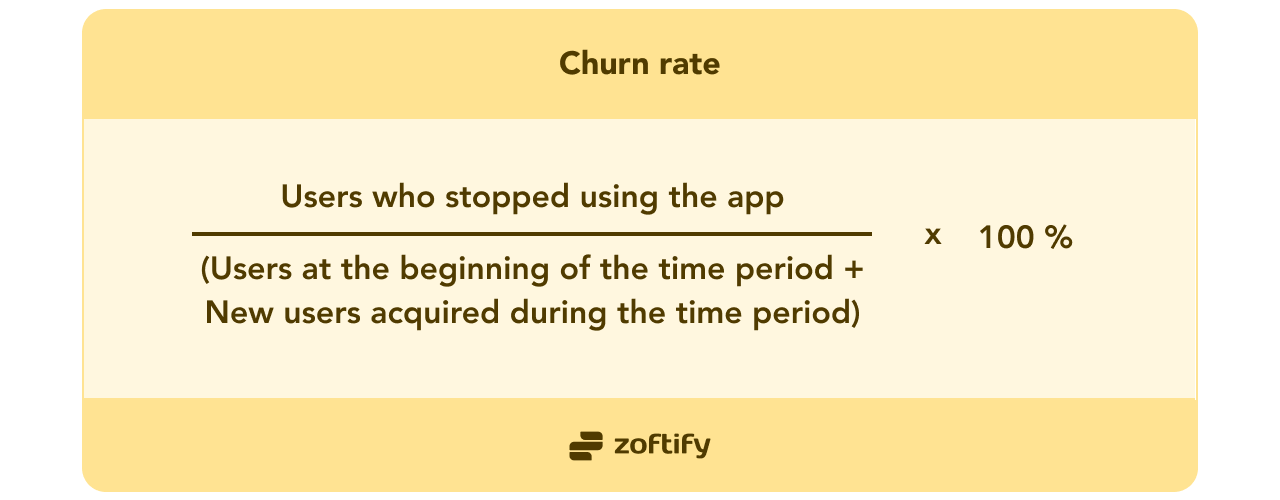
Churn rate
Churn rate refers to the percentage of users who stop using your app altogether within a given period of time. Monitoring your churn rate is critical because high churn means you're losing customers.
Here’s how many users the average travel app loses after different periods of time:
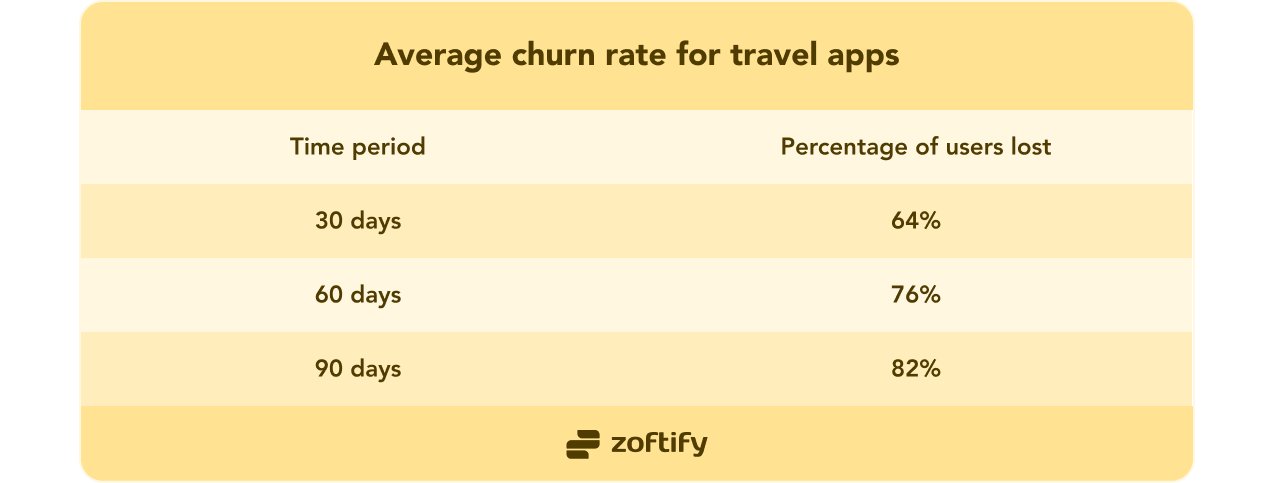
A churn rate that’s higher than average is often a sign that something needs improving in your app. Maybe the user experience is frustrating, the content is lacking, or your marketing doesn’t match what users actually get from your app. Whatever the reason, reducing churn should be a top priority. Some ways to decrease churn include:
-
Improve your onboarding process. Make sure new users quickly see the value in your app. Walk them through key features and set them up for success.
-
Offer incentives for loyalty. Provide special perks, rewards, or subscription discounts for users who have stuck with your app for 6-12 months.
-
Analyze usage data. See if you can spot any patterns among users who churn, like what features they used (or didn’t use), how often they logged in, and their location or device type.
Unlock the full potential of your travel app.
Contact Zoftify for professional guidance.
Marketing metrics
App store ratings and reviews
User ratings and reviews in app stores are some of the clearest ways to tell what users honestly think about their experience. Not only do good ratings attract new users, but they also improve your search ranking in the app stores.
But instead of just looking at each review in isolation, use this formula to gauge whether you receive more positive or negative feedback overall:
To measure review rate you need to decide for yourself what counts as a positive or negative review. Do this by looking at what the reviews say, not at their rating. Also, don’t forget to:
-
Reply to all reviews, especially the negative ones, in a timely manner to show that you are proactive.
-
Thank users for their feedback to show appreciation.
-
Apologize for negative experiences and ask follow-up questions to best resolve the issue.
-
Act on the feedback by making necessary improvements to your app.
In addition to your overall average rating, track how your ratings change over time. Are you trending up or down? Look for any major drops or spikes to determine the cause. Maybe you released an update with bugs or made an unpopular change. The sooner you identify issues, the quicker you can make fixes to get back on track.
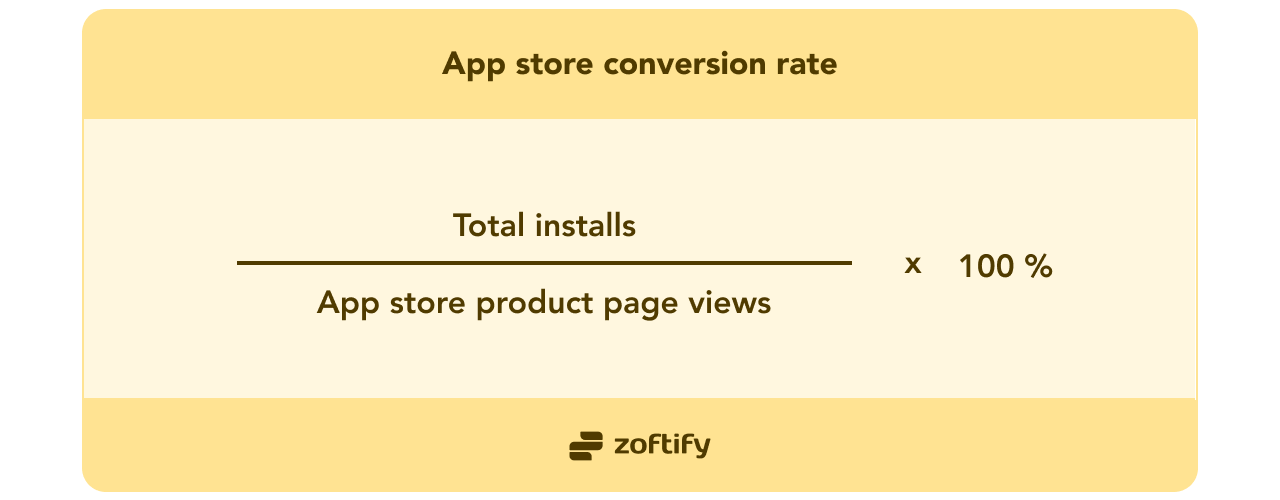
App store conversion rate
This important KPI shows how many people who visit your app page in an app store actually download and install your app.
The average rate for travel apps is around 3% for the App Store according to AppFollow benchmarks. Rates are pretty much consistent throughout the year, but may vary in different countries. For example, let’s look at the stats for July 2023:
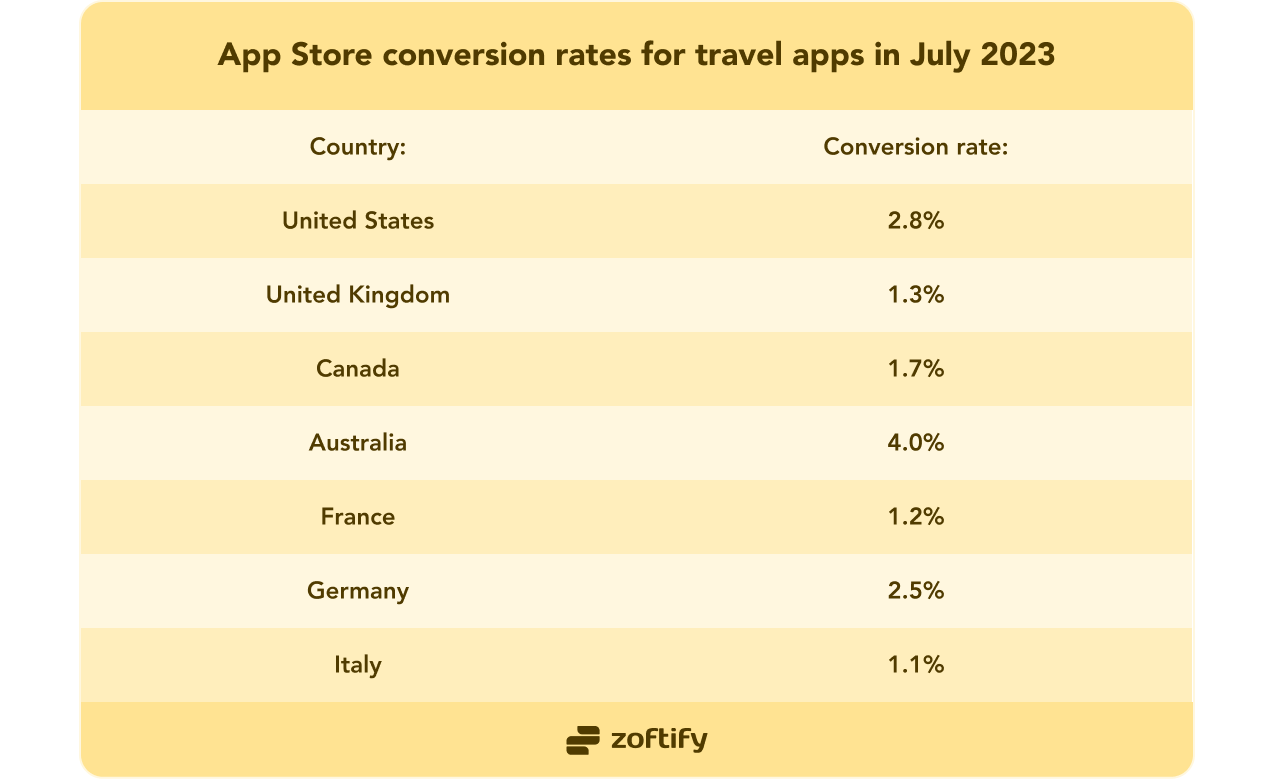
These differences might seem insignificant, but every percent is important, because it directly correlates with the number of new users. A conversion rate equal to or higher than average means your app page is compelling and inspires confidence in your app. If your conversion rate is lower than average, your app page may need some optimization. Double check that:
-
Your app name, description, and metadata are optimized for search.
-
You include eye-catching screenshots that show off your well-designed mobile app’s best features.
-
Your ratings and reviews make people excited to download.
Even increasing your conversion rate by 1-2% can result in many more downloads and a huge boost to your growth.
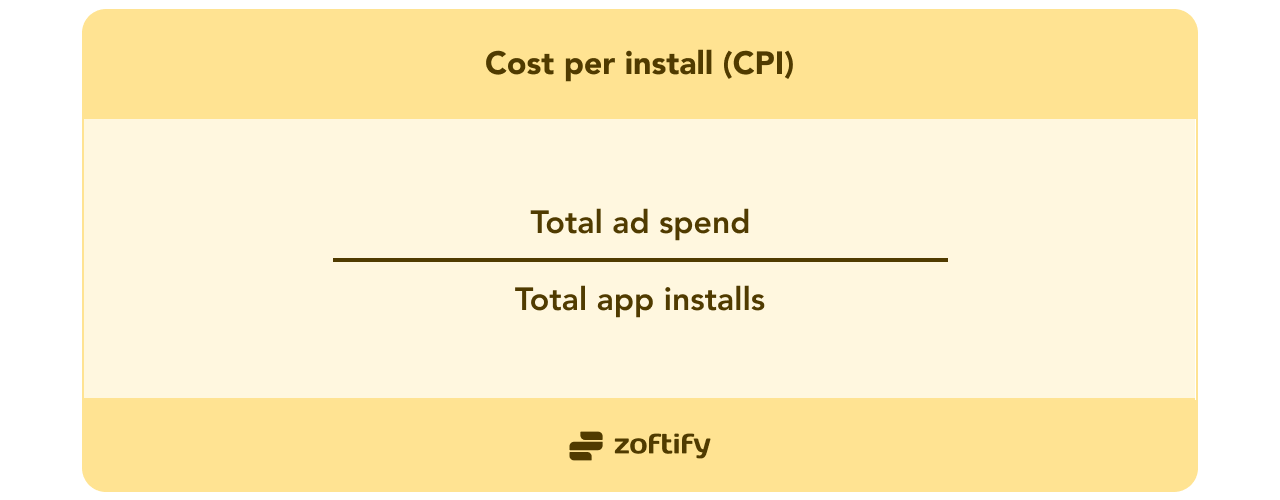
Cost per install (CPI)
Cost per install (CPI) shows you how much it costs to acquire each new user who downloads your app.
As an example, the CPI for Google Ads is $2.24 on average. The numbers vary depending on the region:
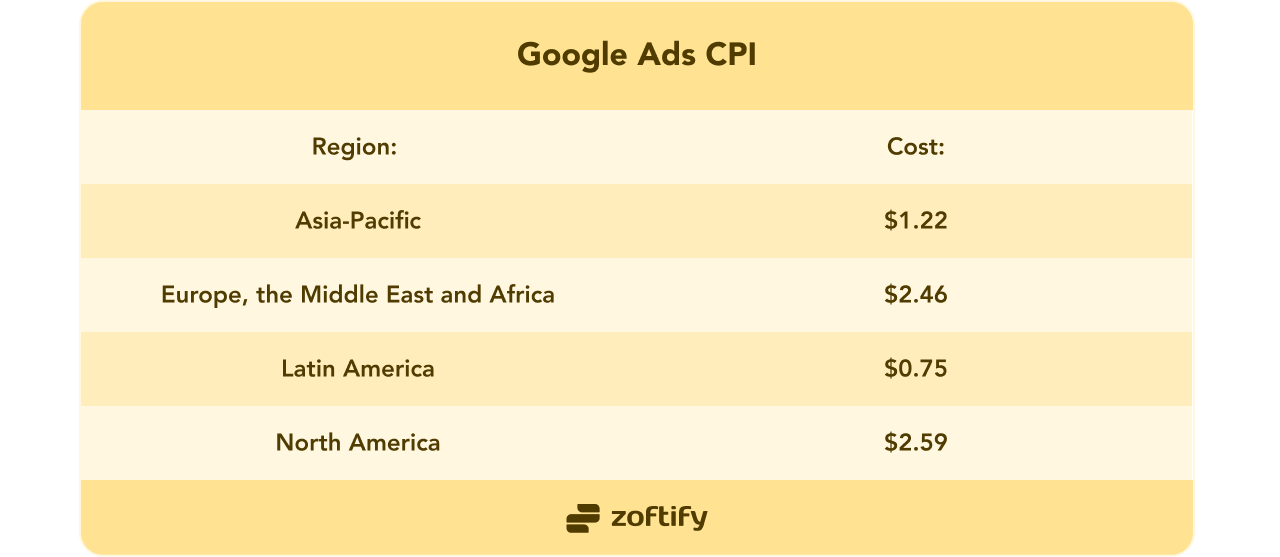
It’s really important to calculate this KPI when setting your marketing strategy. The lower your CPI, the more efficiently your marketing dollars are being spent. If your CPI starts creeping up over time, it may indicate that your marketing strategies are becoming less effective at driving new installs. In that case, try to do the following:
-
Explore new channels or make changes to improve your targeting and messaging.
-
Track the KPI over time and by channel to see which platforms and campaigns are most cost-effective for acquiring users.
-
Identify cost-effective platforms and focus on channels with the lowest CPI. For example, you may find social media ads have a lower CPI than search ads.
Travel mobile app performance metrics
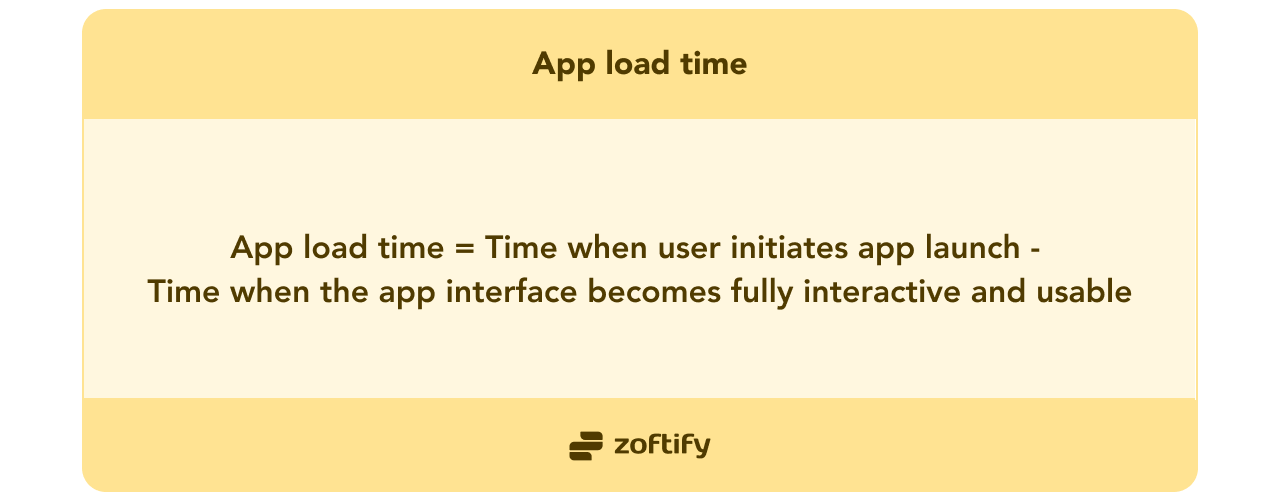
App load time
Knowing how quickly your app loads is crucial. If it takes more than a few seconds, users will likely abandon it. Measure the time from someone tapping your app icon to when the content is interactive and functional.
Keep in mind that there are different types of app launches — cold, hot and warm — so you’ll need to factor this into your calculation. When you launch an app from scratch (cold launch), the system needs to start up various processes to support the app to run. In a hot launch, the app is already in the system’s memory, it just needs to be brought to the front, so it will open quickly. A warm launch is in between. Some cold start operations still happen, but the app will open quicker than if it was opening from scratch.
Your app's startup time can be considered acceptable if it falls within these thresholds:
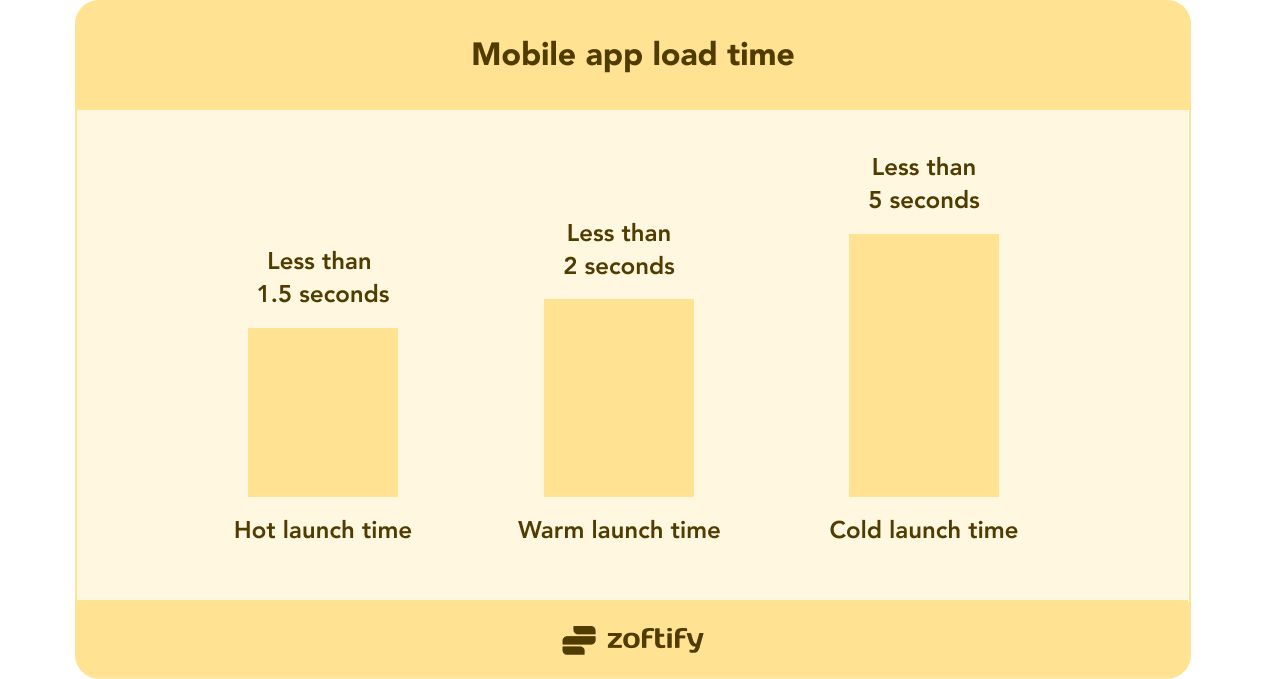
Aim for these averages — a load time of 5-10 seconds or more will frustrate your users. Here’s how you can improve load time:
-
Regularly check that updates or new features are not slowing down the app.
-
Adjust image sizes for optimal performance.
-
Implement caching mechanisms to enhance speed.
-
Focus on code optimizations to improve app responsiveness.
App crashes and errors
When an app crashes or bugs out, users get frustrated. Measure the number of app crashes and errors to determine how often this happens. If it's often, you'll lose users fast.
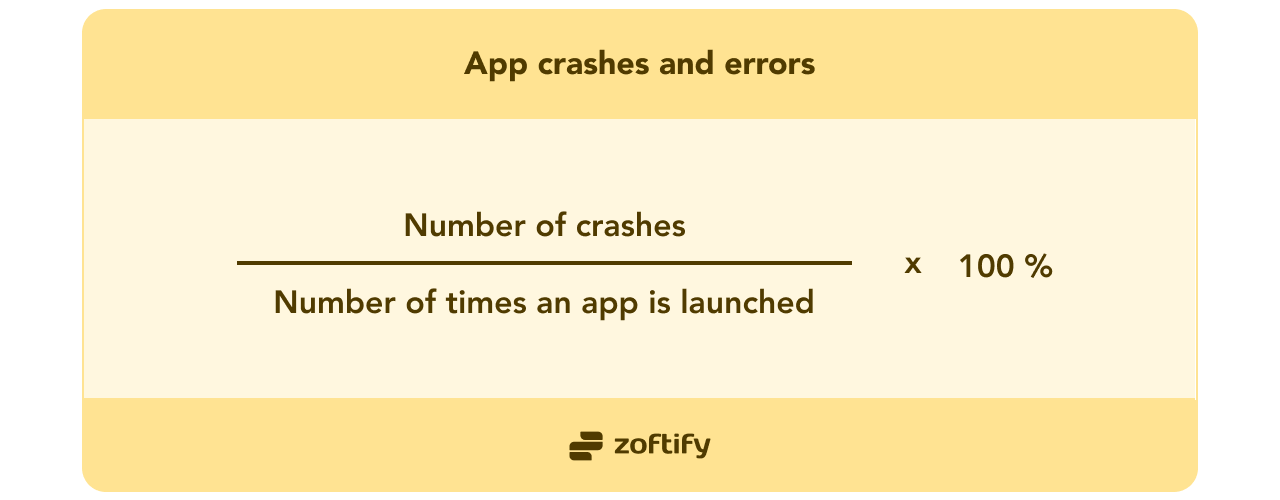
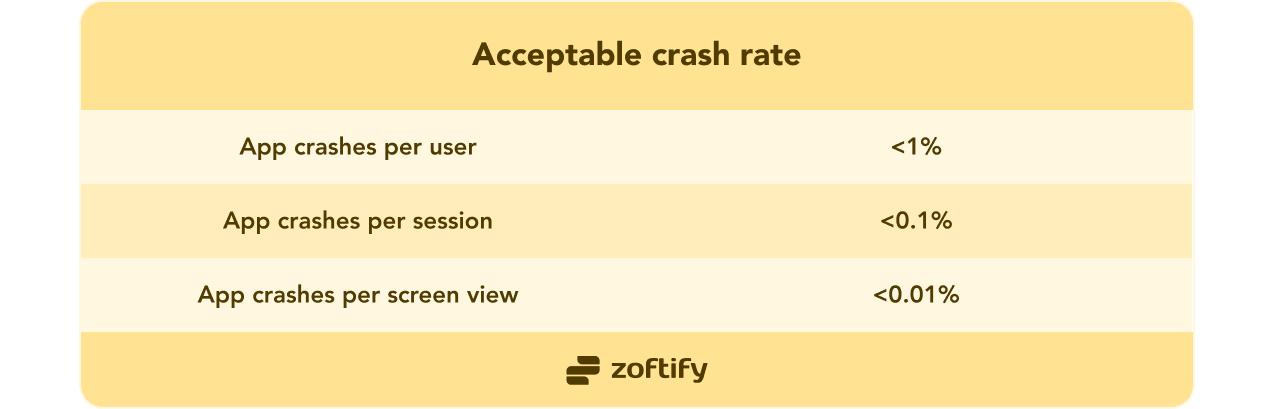
The odd crashes and errors here and there in mobile apps are okay. But use the acceptable crash rate to help you determine whether your app has a serious problem.
Follow these steps to track and fix any issues the right way:
- Look at crash reports and error logs.
- Examine what’s causing the issue and if it happens repeatedly.
- Change your code to solve the issue.
- Make sure everything works by testing thoroughly.
- Give users the new, fixed version of the app.
Once you’ve fixed the problem, let your users know. They'll appreciate your responsiveness.
Want to know more about tourism mobile app success metrics?
Get in touch with us today.
Wrapping up
Data is only useful if you actually analyze it and take action. Review these essential KPIs regularly and make changes to your app based on what the data is telling you. With regular tracking and refining, you’ll be well on your way to travel app success. Your users will thank you for it with more time spent in-app and more travel bookings.
Alex loves travel and tech and founded Zoftify to help travel companies use technology more effectively. Before this, he worked in tech consulting, where he led international mobile development teams.
4.87 (34)